
Org chart analytics
See engagement gaps before deals slip.
Layer heatmaps, buying roles and custom views over any org chart. Know at a glance who's warm, who's cold, and who you haven't reached yet.
Engagement heatmap · view
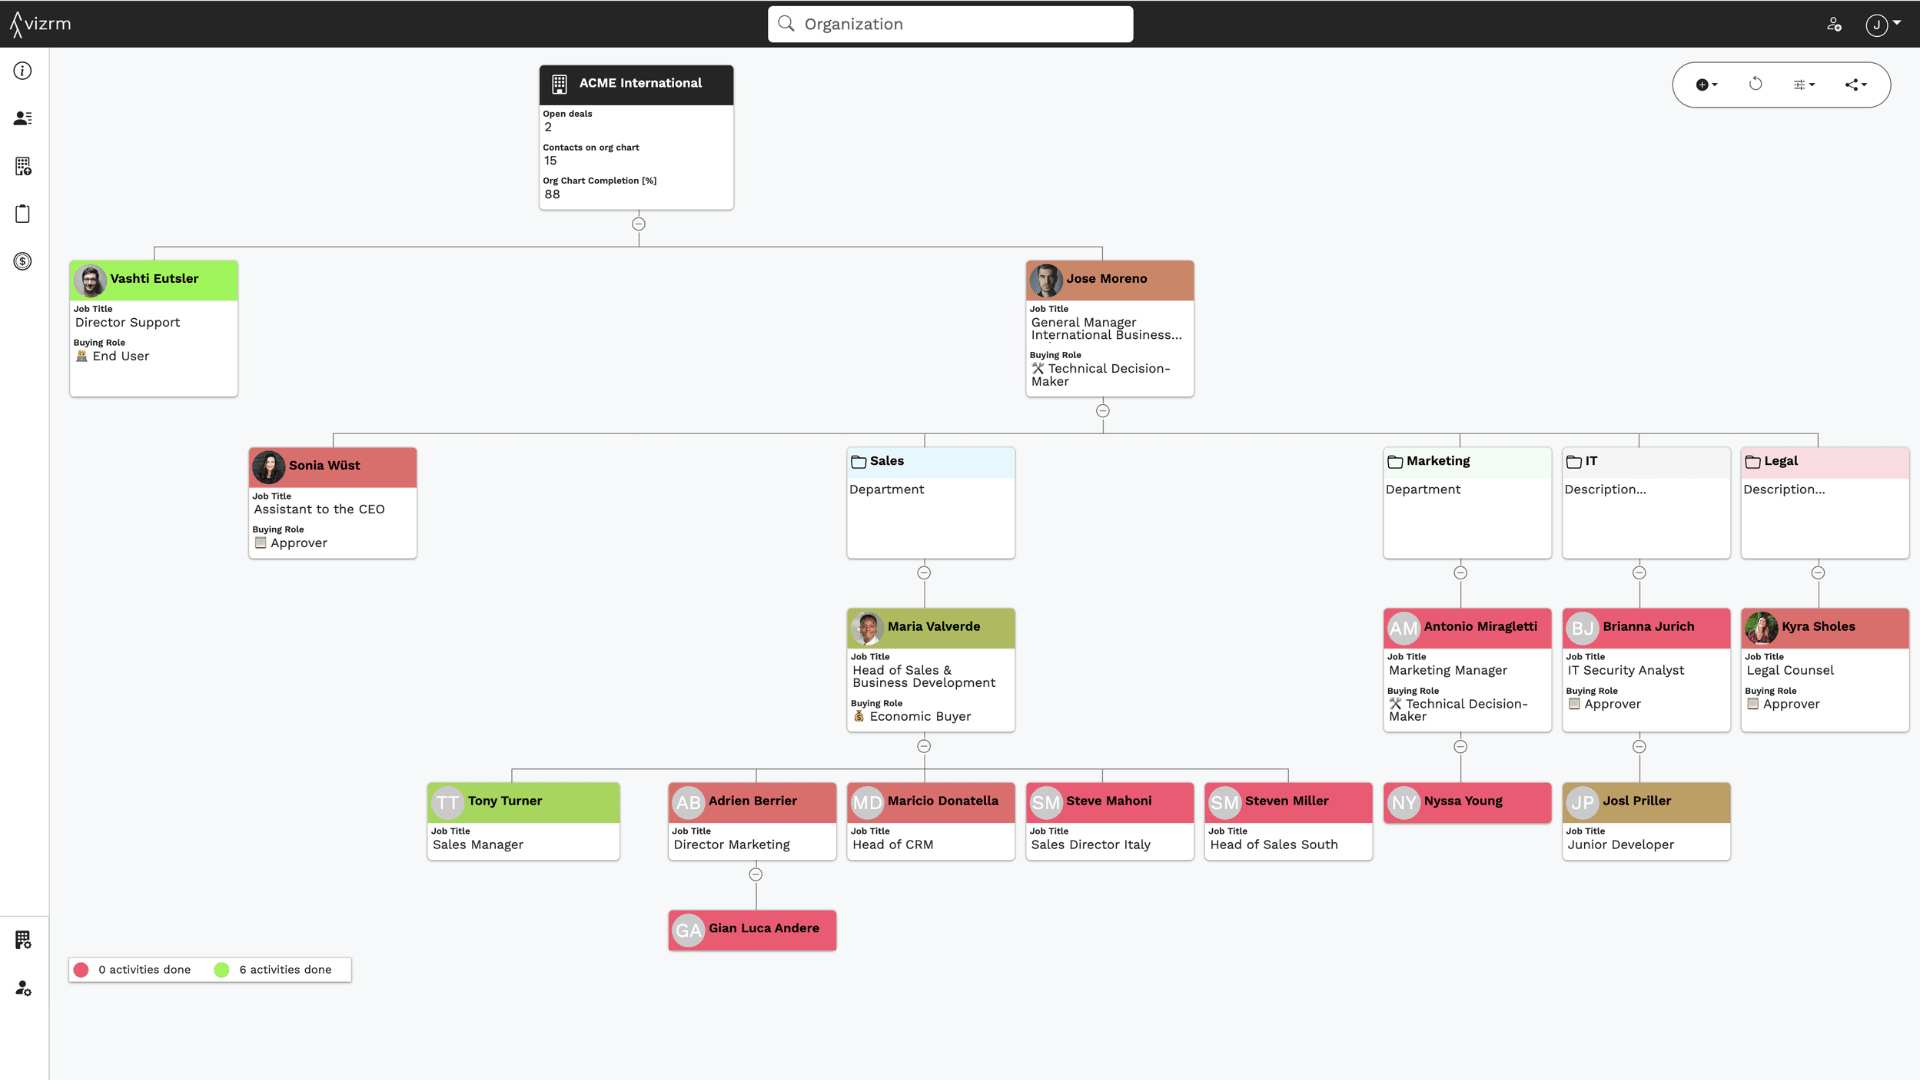
Turn the chart into an analytical tool
Read engagement at a glance, then make the view your own.
01Basic
Engagement heatmaps
Pre-built heat-maps by completed activity, open deals or last contact date. Warm contacts go green, cold ones red.
Done activities, last contact, deal value and more
Spot neglected stakeholders in a single glance
Engagement heatmaps
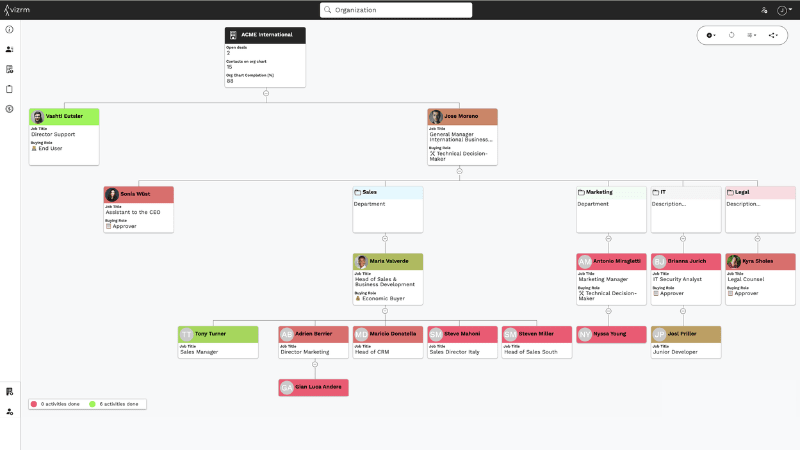
What the analysis layer gives you
Turn a finished org chart into a fast read on account health - and let leaders track coverage without chasing reps.
See who's warm and who's cold across the buying committee at a glance.
Color the chart by buying role or any CRM field to spot the gaps.
Sync coverage KPIs to your CRM so leaders build their own dashboards.
Vizrm has become an essential tool for our business development team. It keeps stakeholder mapping consistent across the team, gives us clear visibility of engagement levels in key accounts, and helps us navigate complex deals with more confidence. Highly recommended for any commercial team managing multi-stakeholder sales.
 Bjorn MadsenChief Commercial Officer · Pelagus
Explore the rest of vizrm
Org chart builderBuild living account maps inside your CRM.See full details LinkedIn integrationAdd contacts without leaving your workflow.See full details HubSpot integrationLives inside HubSpot - no tab switching.See full details Pipedrive integrationLives inside Pipedrive, in the sidebar.See full details
See who's warm, who's cold - at a glance.
Layer heatmaps and custom views over any org chart in HubSpot or Pipedrive.
Free to install · No credit card required · HubSpot & Pipedrive