Olivier’s Practical Guide For Signal-Driven Strategic Account Management
How a Strategic AE Uses vizrm to Win Complex Industrial Accounts
tl;dr
Discover how vizrm customer Olivier Tyrbas, Senior Strategic AE, built a repeatable 5-phase system for winning complex enterprise accounts - using market signals, org chart mapping, and vizrm’s relationship intelligence features to land meetings that cold outreach never could.
The Challenge: The Death of Traditional Prospection
As a Senior Strategic AE - selling into complex industrial sectors like aerospace, defense, and food and beverage - Olivier identified a fundamental shift in the market: the traditional volume-based sales model, in which you contact thousands of people to guarantee a percentage of conversions, no longer works.
Today’s buyers can get initial product information from AI tools without ever speaking to a rep. At the same time, AI-powered outreach has flooded their inboxes, making it nearly impossible for any single message to break through. The result: generic prospecting is effectively dead.
In response, Olivier developed a 5-phase approach to enterprise prospecting - one built on intelligence, precision, and relationship mapping rather than volume.
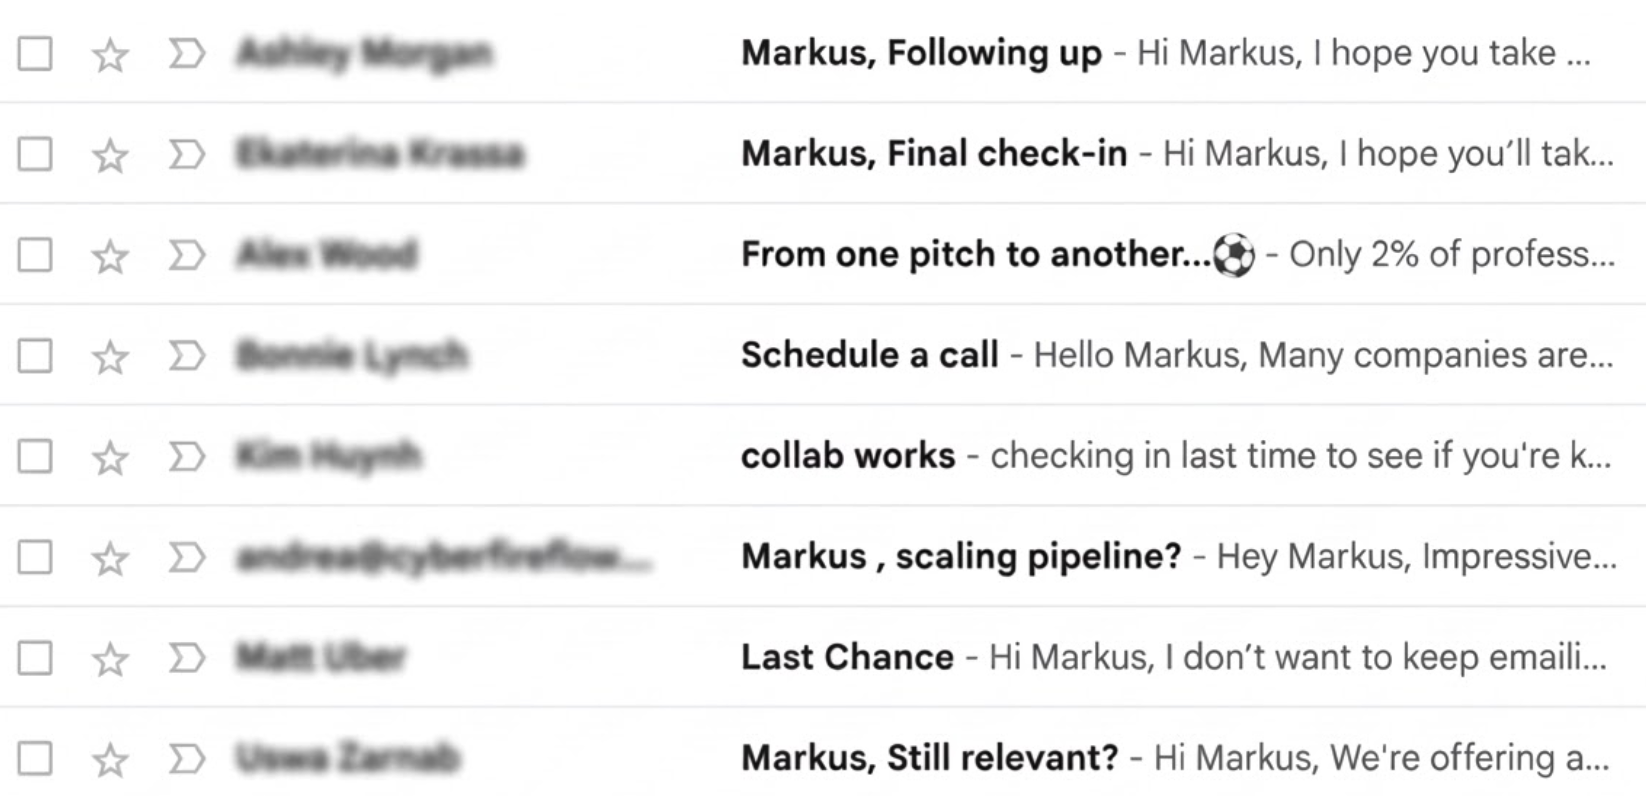
A founder’s daily inbox -swamed with cheap outbound
Phase I: Intelligence & Signal Detection
Rather than prospecting blindly, Olivier’s process starts by detecting signals that a company has an active, relevant problem - before any outreach begins.
Keyword Monitoring: Scanning the web, LinkedIn, and even TV shows for specific keywords (e.g., "new production line") can indicate whether a company has a concrete problem that his solution can fix.
Confidence Scoring: Based on these inputs, Olivier generates a confidence score to prioritize which accounts deserve his attention. This keeps his active pipeline to a focused set of roughly 200 projects per year.
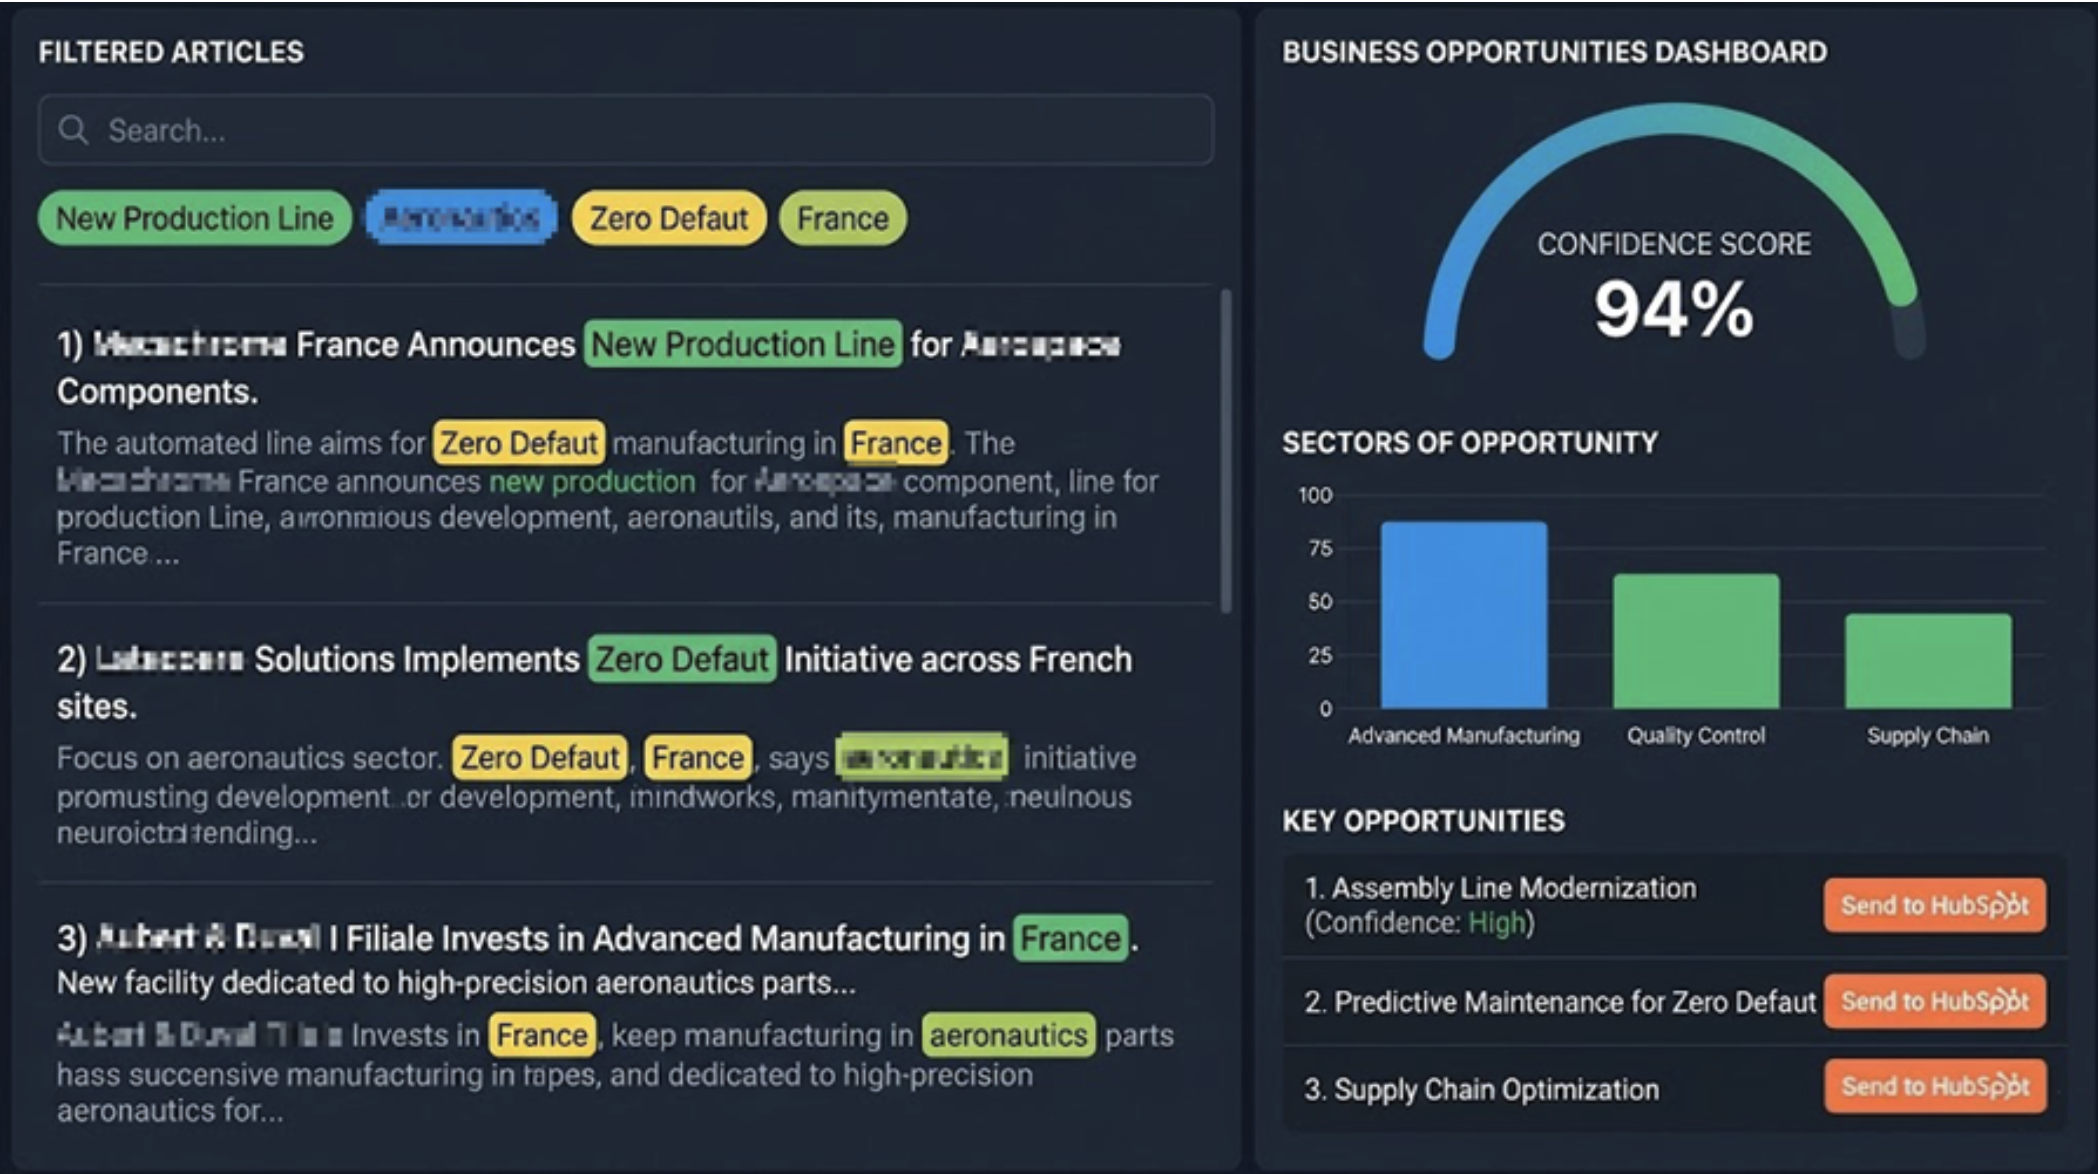
Advanced Account Intelligence - example
Phase II: Pre-Contact Mapping
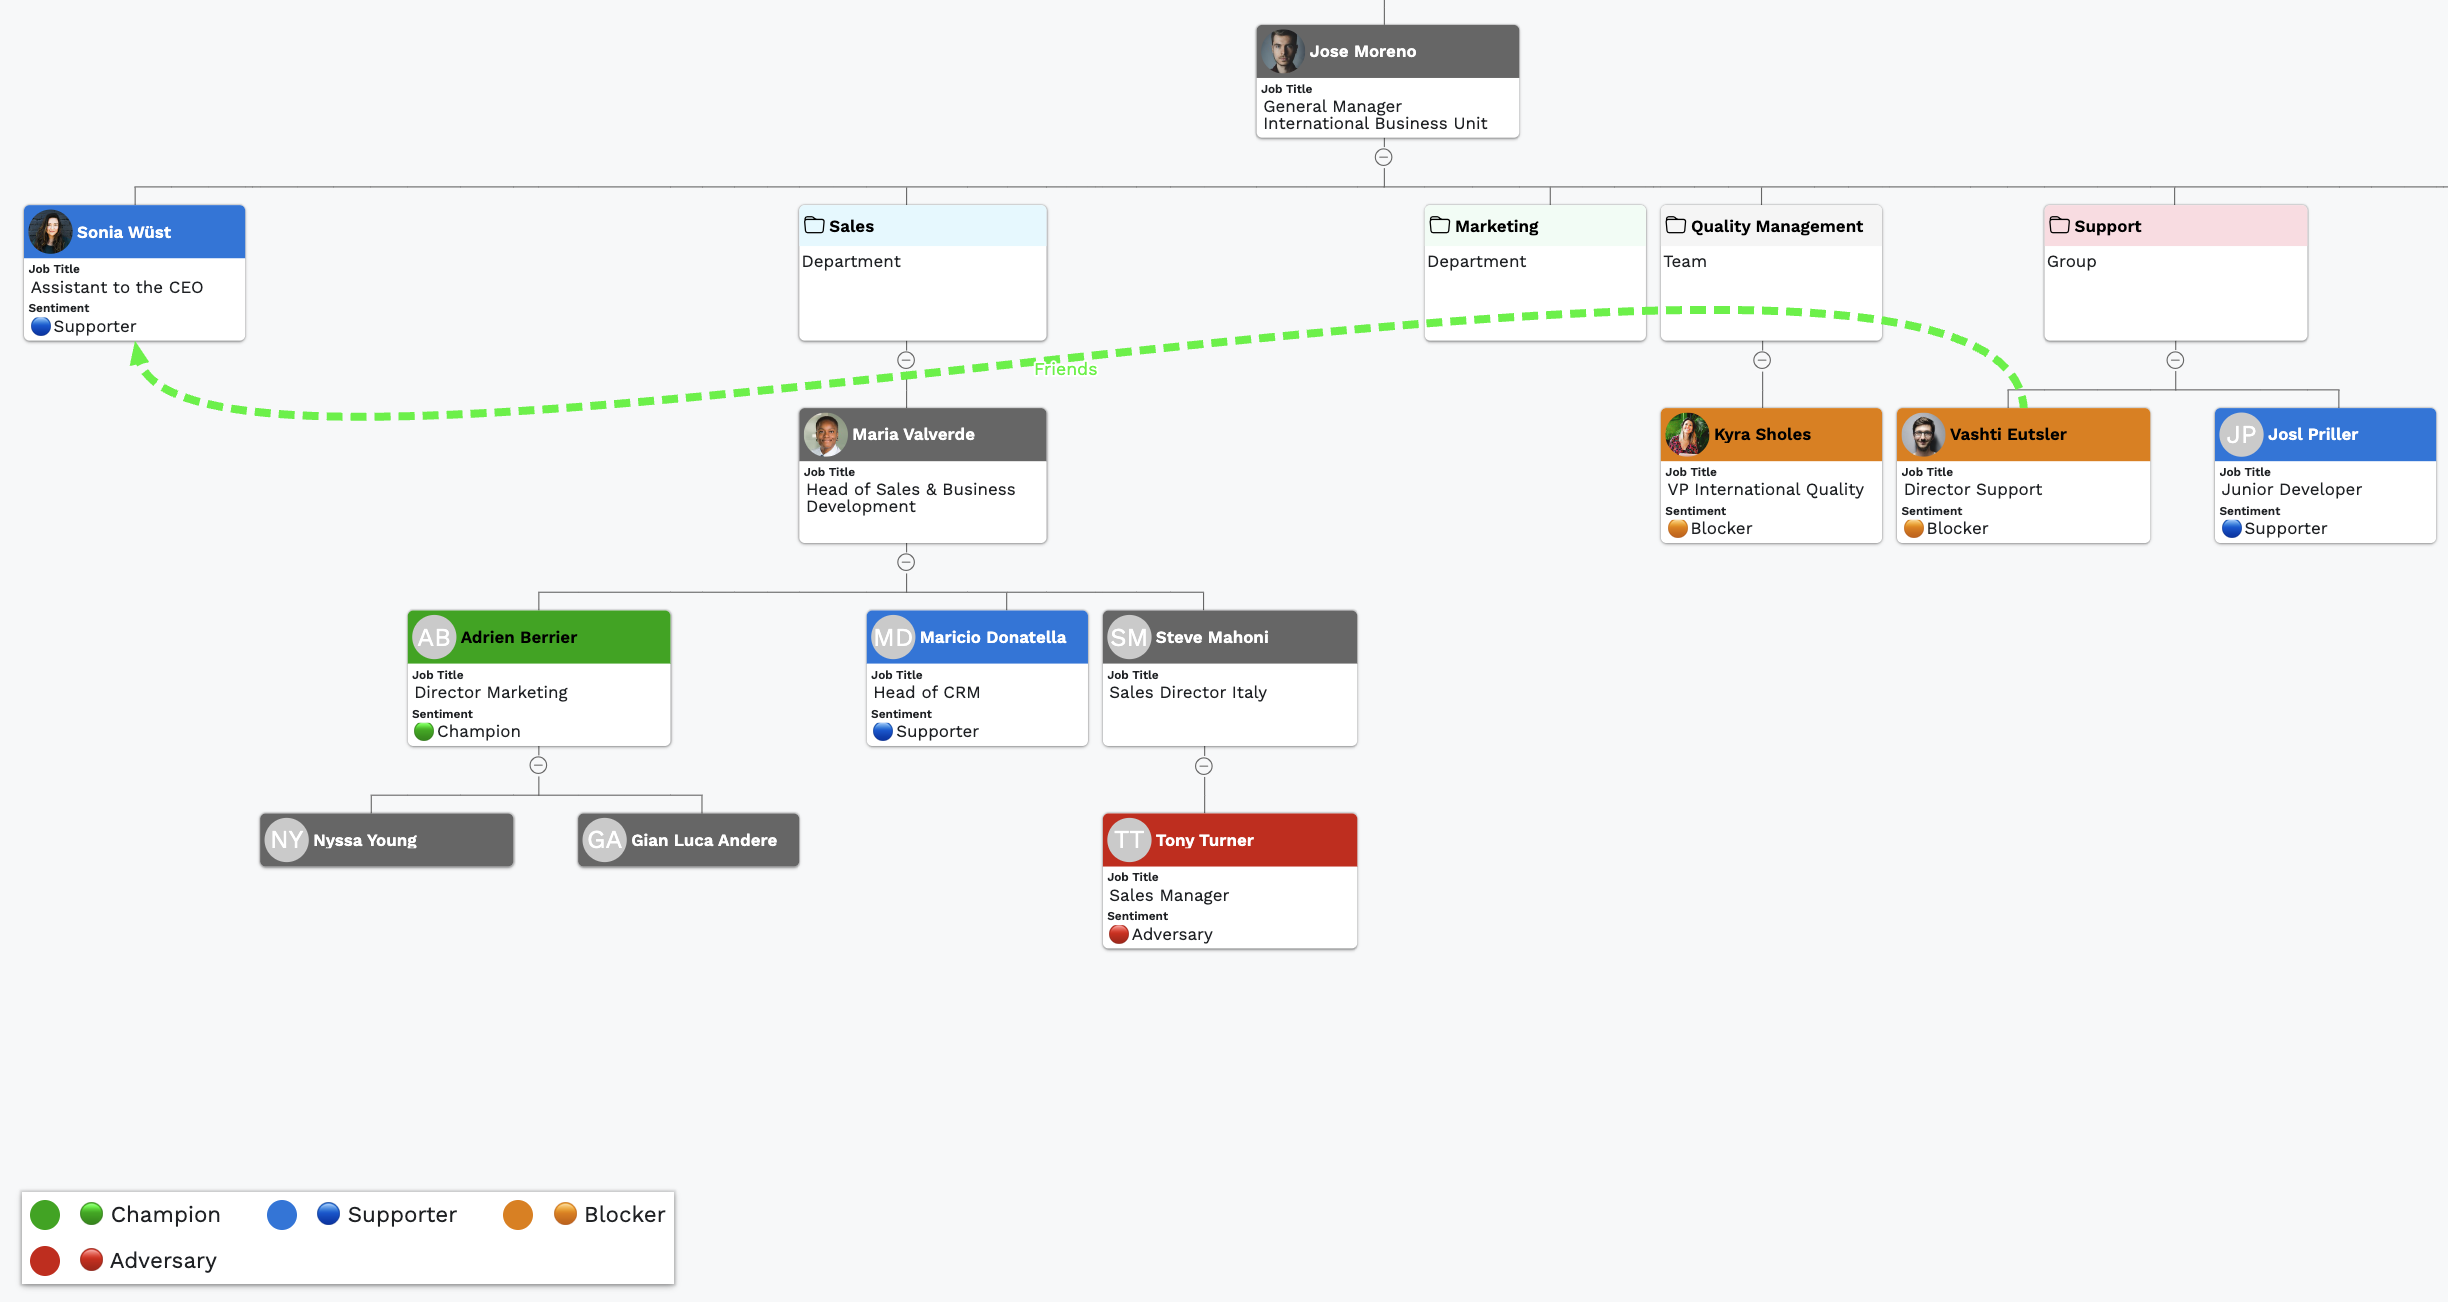
Before making a single call or sending a single email, Olivier uses vizrm to build a complete picture of the target organization using publicly available data. He calls this the “skeleton map” phase: building enough structural knowledge to reach out intelligently, not blindly.
Visualizing the Account Structure: Using public data and pattern recognition from similar accounts, Olivier builds a structural map of the organization in vizrm - grouping units, departments, and teams using the “groups” feature. This phase is inherently collaborative: team members can work together on the same map simultaneously.
Visualizing the Org Chart: The skeleton structure is now populated with real contacts - linked by title and function to reveal hierarchy and reporting lines. Olivier relies heavily on the vizrm LinkedIn extension here, which lets him add contacts to the org chart directly from LinkedIn profiles without manual data entry.
Identifying the "White Space": With the org chart populated, the map clearly shows who Olivier has not yet reached - surfacing gaps in coverage across a large, complex account before outreach even begins.
Pro tip: Most large organizations share a predictable structure - IT, HR, Sales, Operations, and so on. If a branch is missing from your map, that’s a “dark zone” worth investigating. As a sanity check, Olivier notes that in most large companies, a manager leads a team of 3–5 people. If your org chart shows far more or far fewer reports than that, it’s a signal the map needs refining. Don’t rely on LinkedIn alone - not everyone has an active profile.
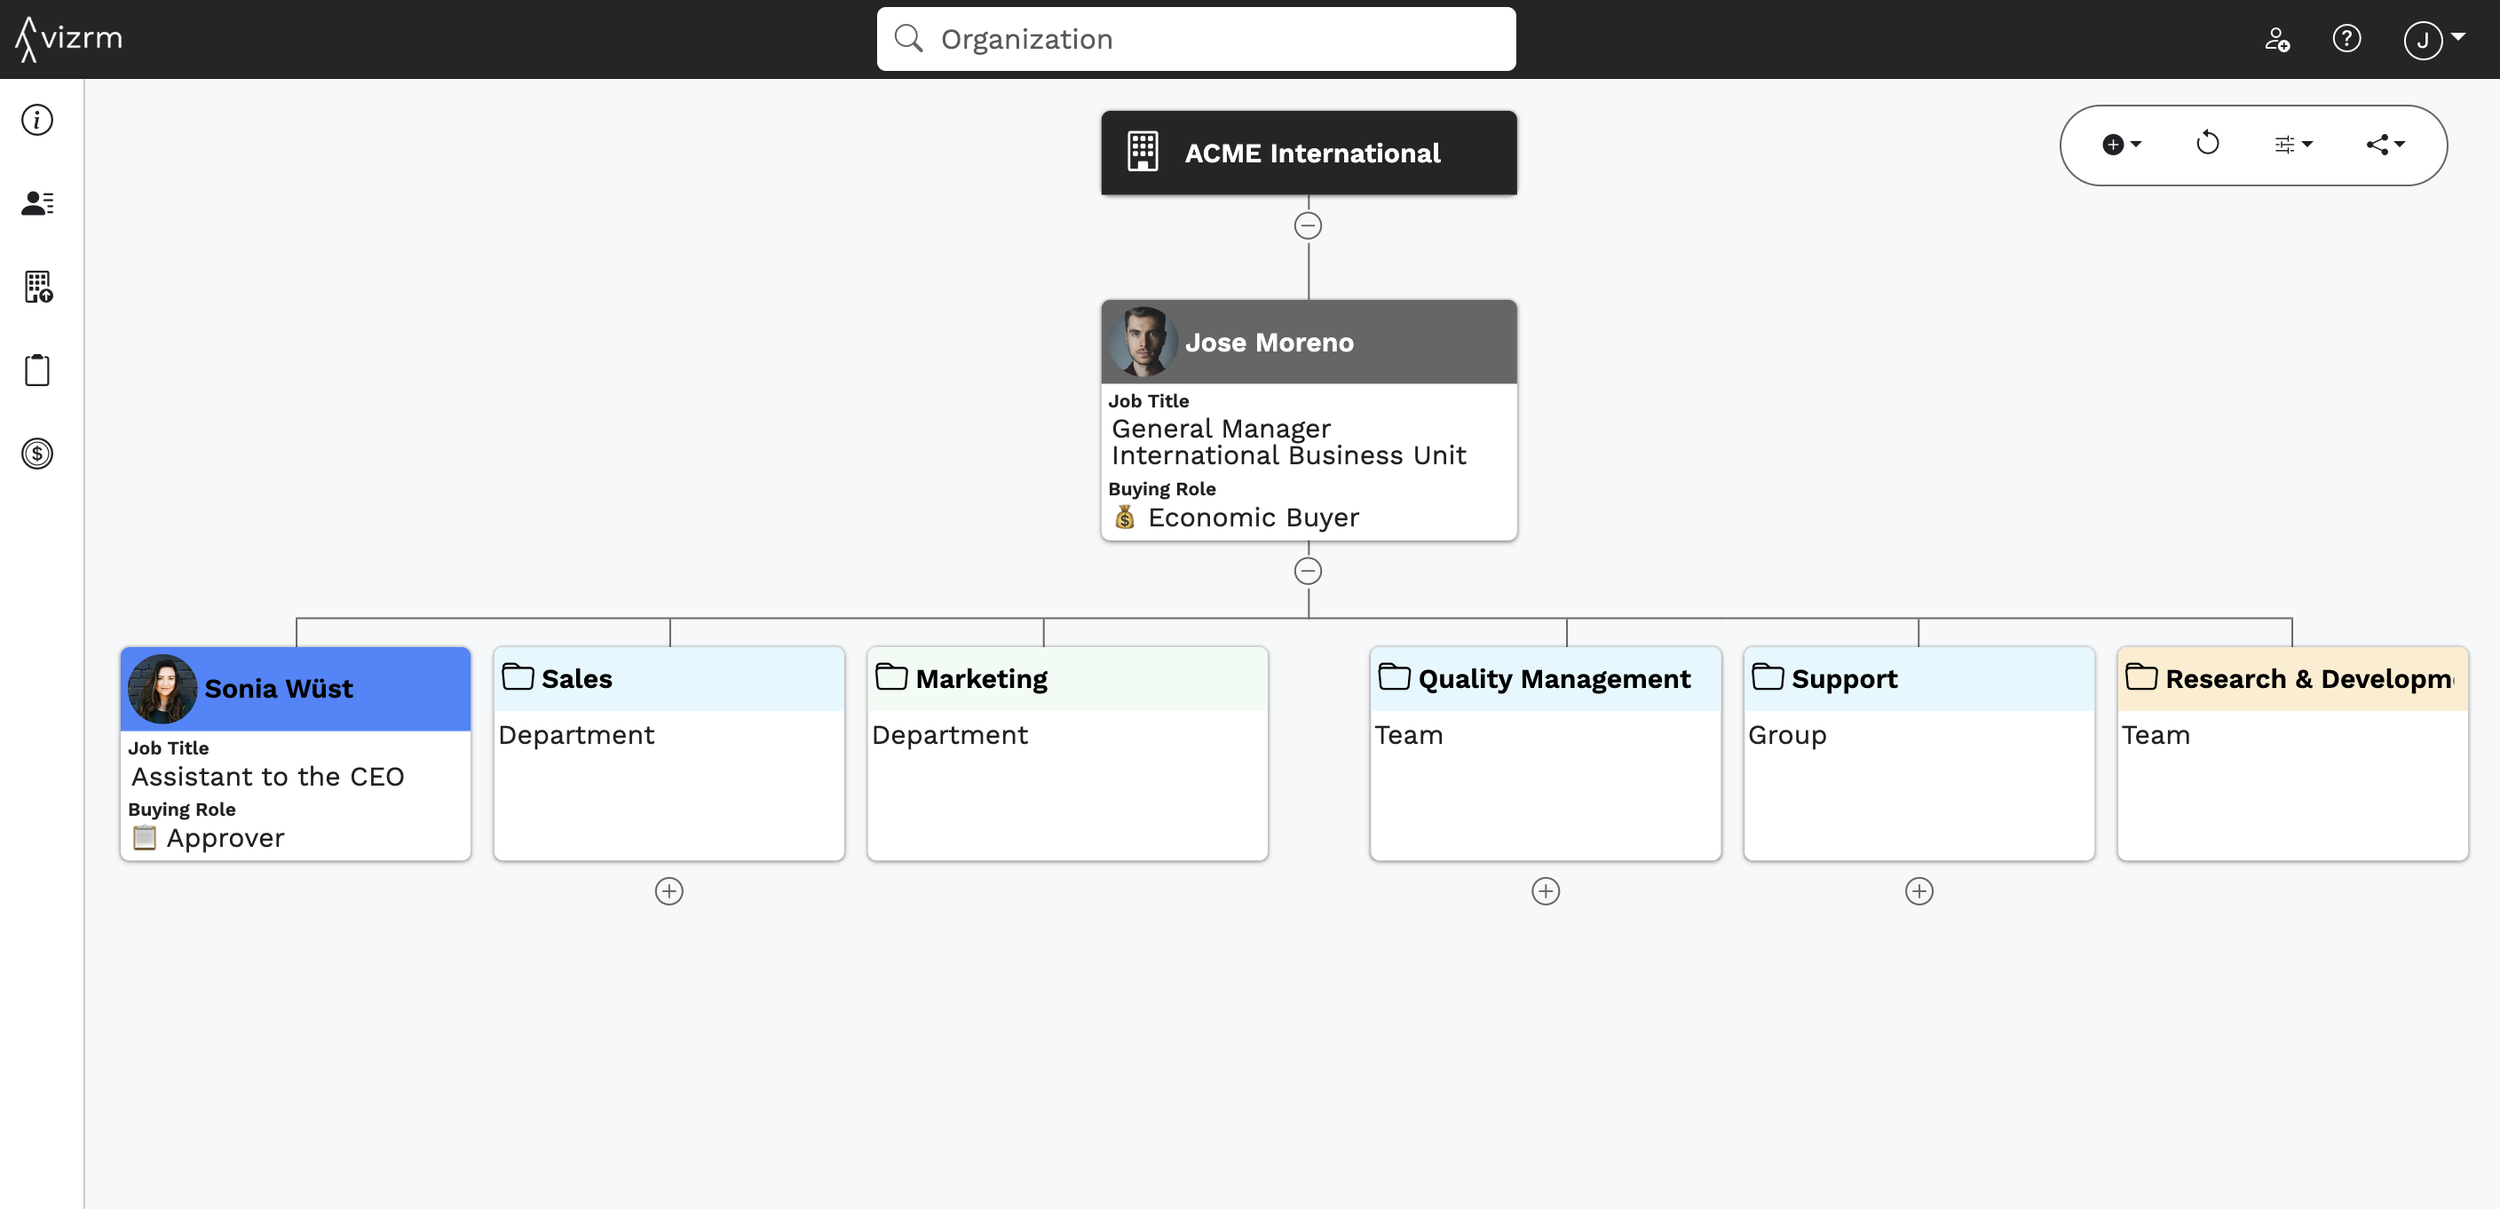
An example “skeleton map” of a strategic account
Phase III: Customized Augmented Argumentation
Once the target is identified and mapped, the outreach is highly personalized.
Problem-Focused Messaging: Instead of a generic pitch, Olivier approaches the contact with a message tailored to the specific signal he detected (e.g., an article in which the company expressed interest in expanding into the French market).
Augmented Argumentation: He uses the research to provide a direct answer to the specific question or issue the company is currently facing.
The org chart at this stage should be as accurate as possible, but it’s treated as a living document - hypotheses about structure get validated or corrected through each conversation.
The goal is to track message reception across the account - mapping who has engaged, who has been reached, and who remains uncontacted.
This solves one of the most common mistakes in enterprise sales: assuming silence means disinterest. Often, the message simply never reached the right person. vizrm’s engagement tracking makes the difference visible.
Phase IV: Relationship & Sentiment Analysis
As conversations begin, Olivier shifts vizrm into a relationship intelligence tool, tracking stakeholder sentiment, influence, and his overall momentum within the account.
Mapping Stakeholder Sentiment: He identifies stakeholders' commitment on the org chart using a custom CRM field. The view configuration feature in vizrm helps to quickly color the account map for a sentiment analysis.
The "Authority vs. Relevance" Matrix: Olivier categorizes contacts based on two dimensions to determine his next move:
Relevance: How much they are personally suffering from the problem that his solution solves.
Authority/Power: How much influence they have over the final decision.
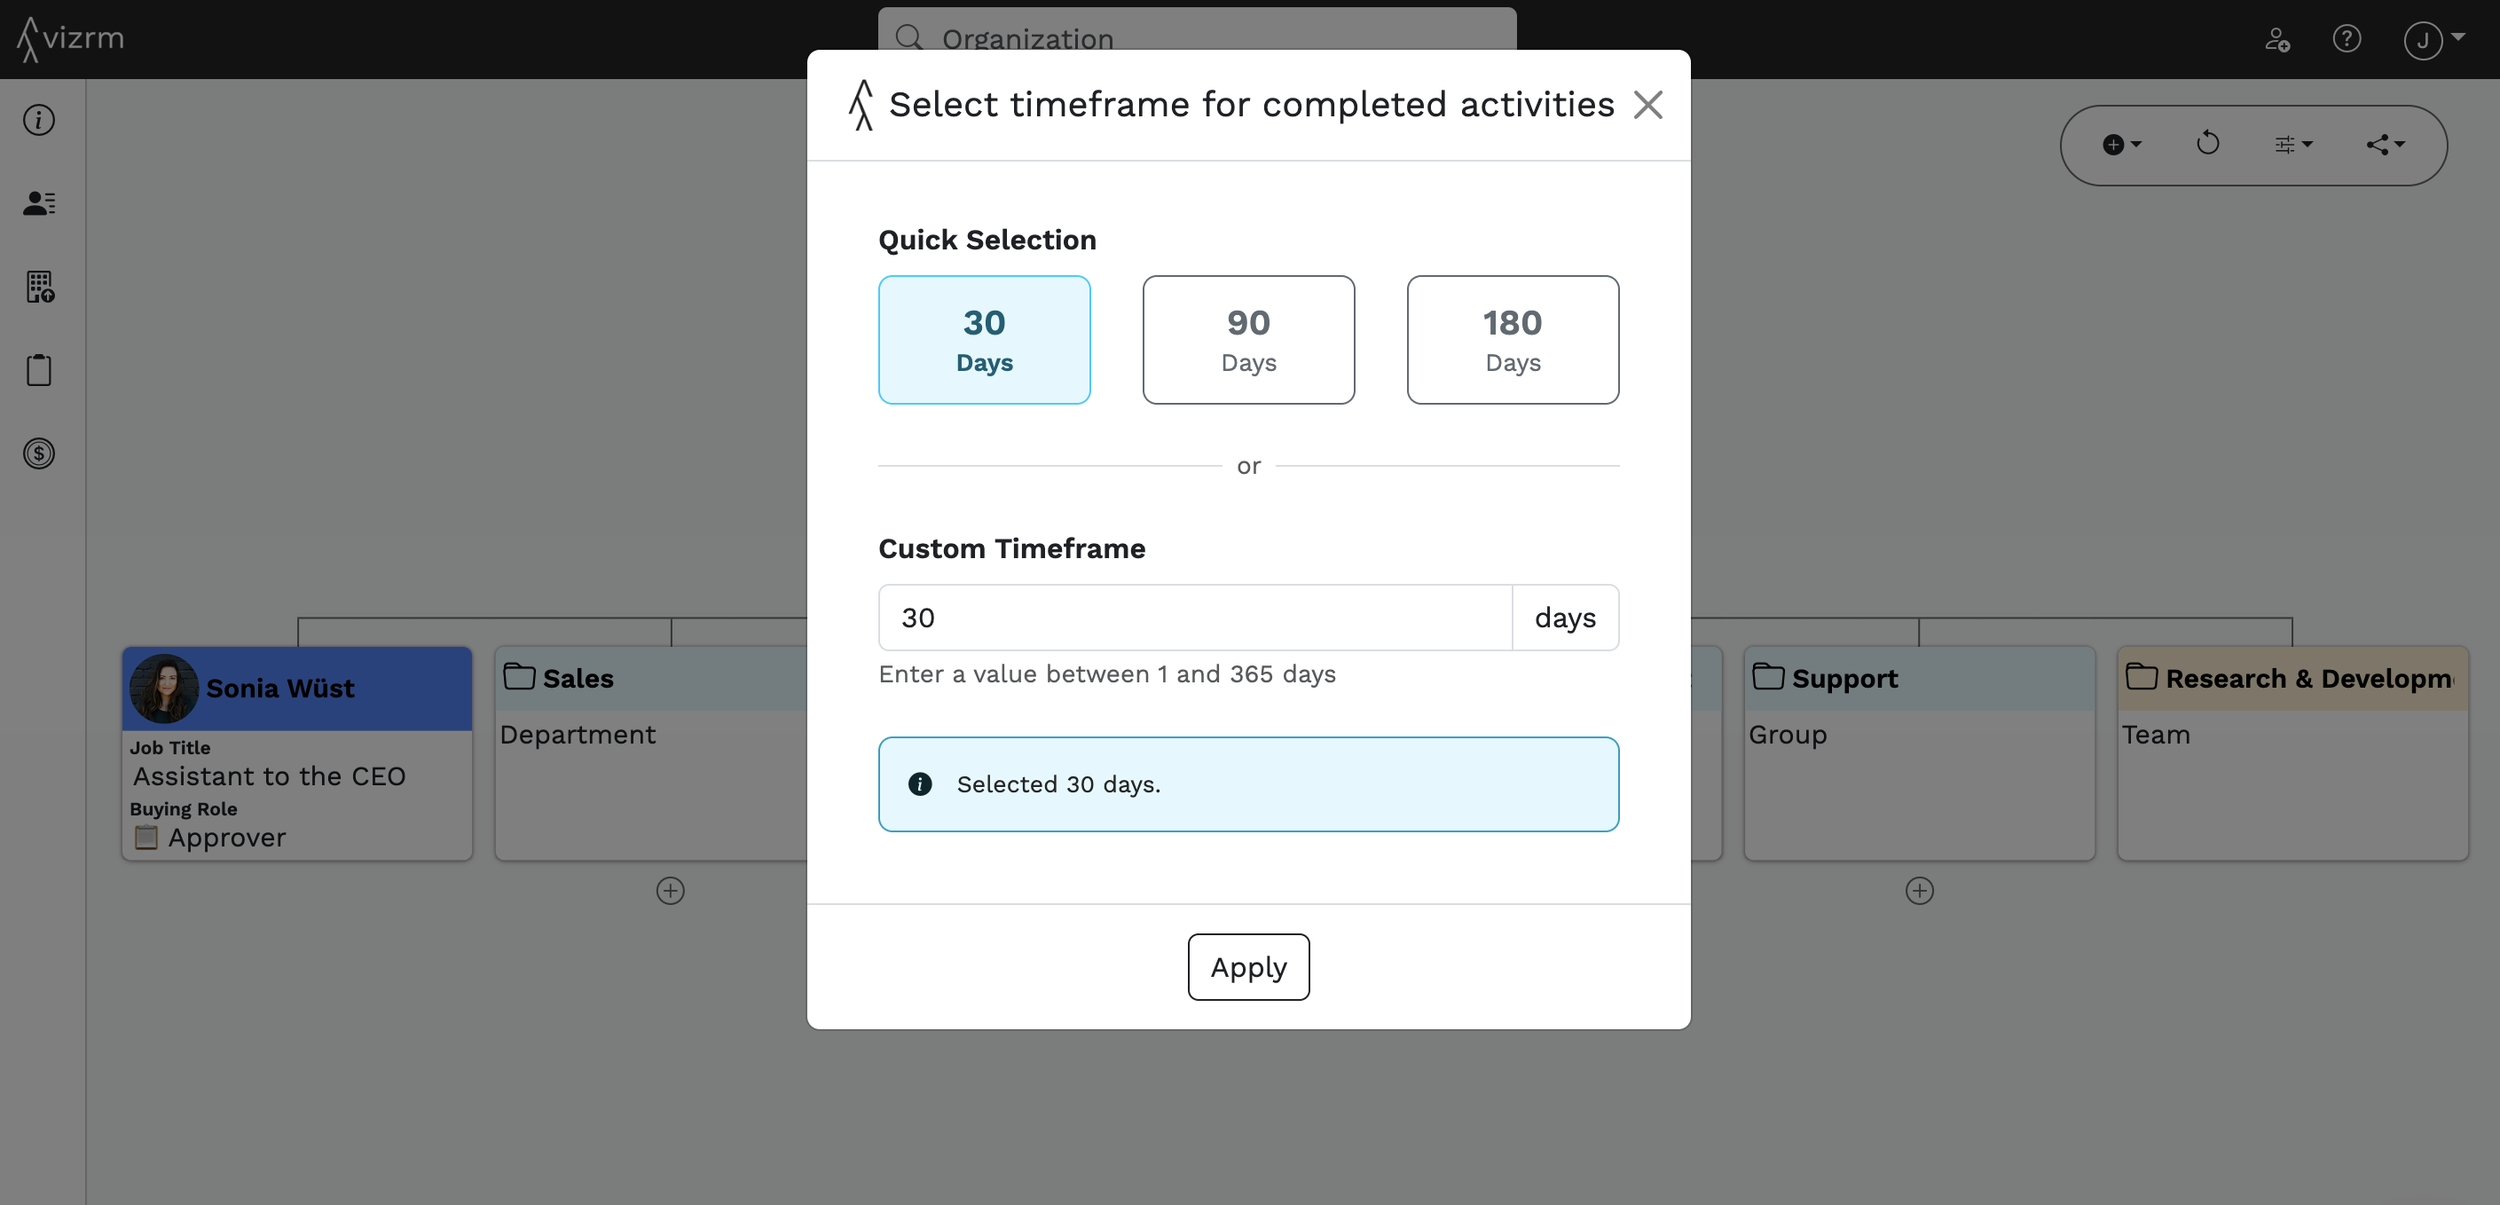
Progression Tracking: Lastly, Olivier uses the tool to visualize whether he is "winning or losing" ground in the account over time based on vizrm activity heat maps.
Using vizrm’s color-coding, Olivier assigns each stakeholder a status at a glance: light green for supporters, dark green for decision-makers, yellow for neutral contacts, red for opponents, and black for those not involved in the decision.
The relationship links between contacts - who knows whom, and who has influence over whom - are just as important as the individuals themselves. vizrm makes these connections visible on the map.
Demo example of a sentiment view in vizrm
Phase V: Scaling Across a Group
For large global accounts, the same approach scales across the entire corporate group. vizrm’s group view lets Olivier track penetration across every subsidiary - ensuring no business unit is overlooked.
This also helps sales teams avoid overlap and clearly divide territory - for example, one rep owns the French subsidiary while another handles Germany - all visible and coordinated within the same vizrm account.
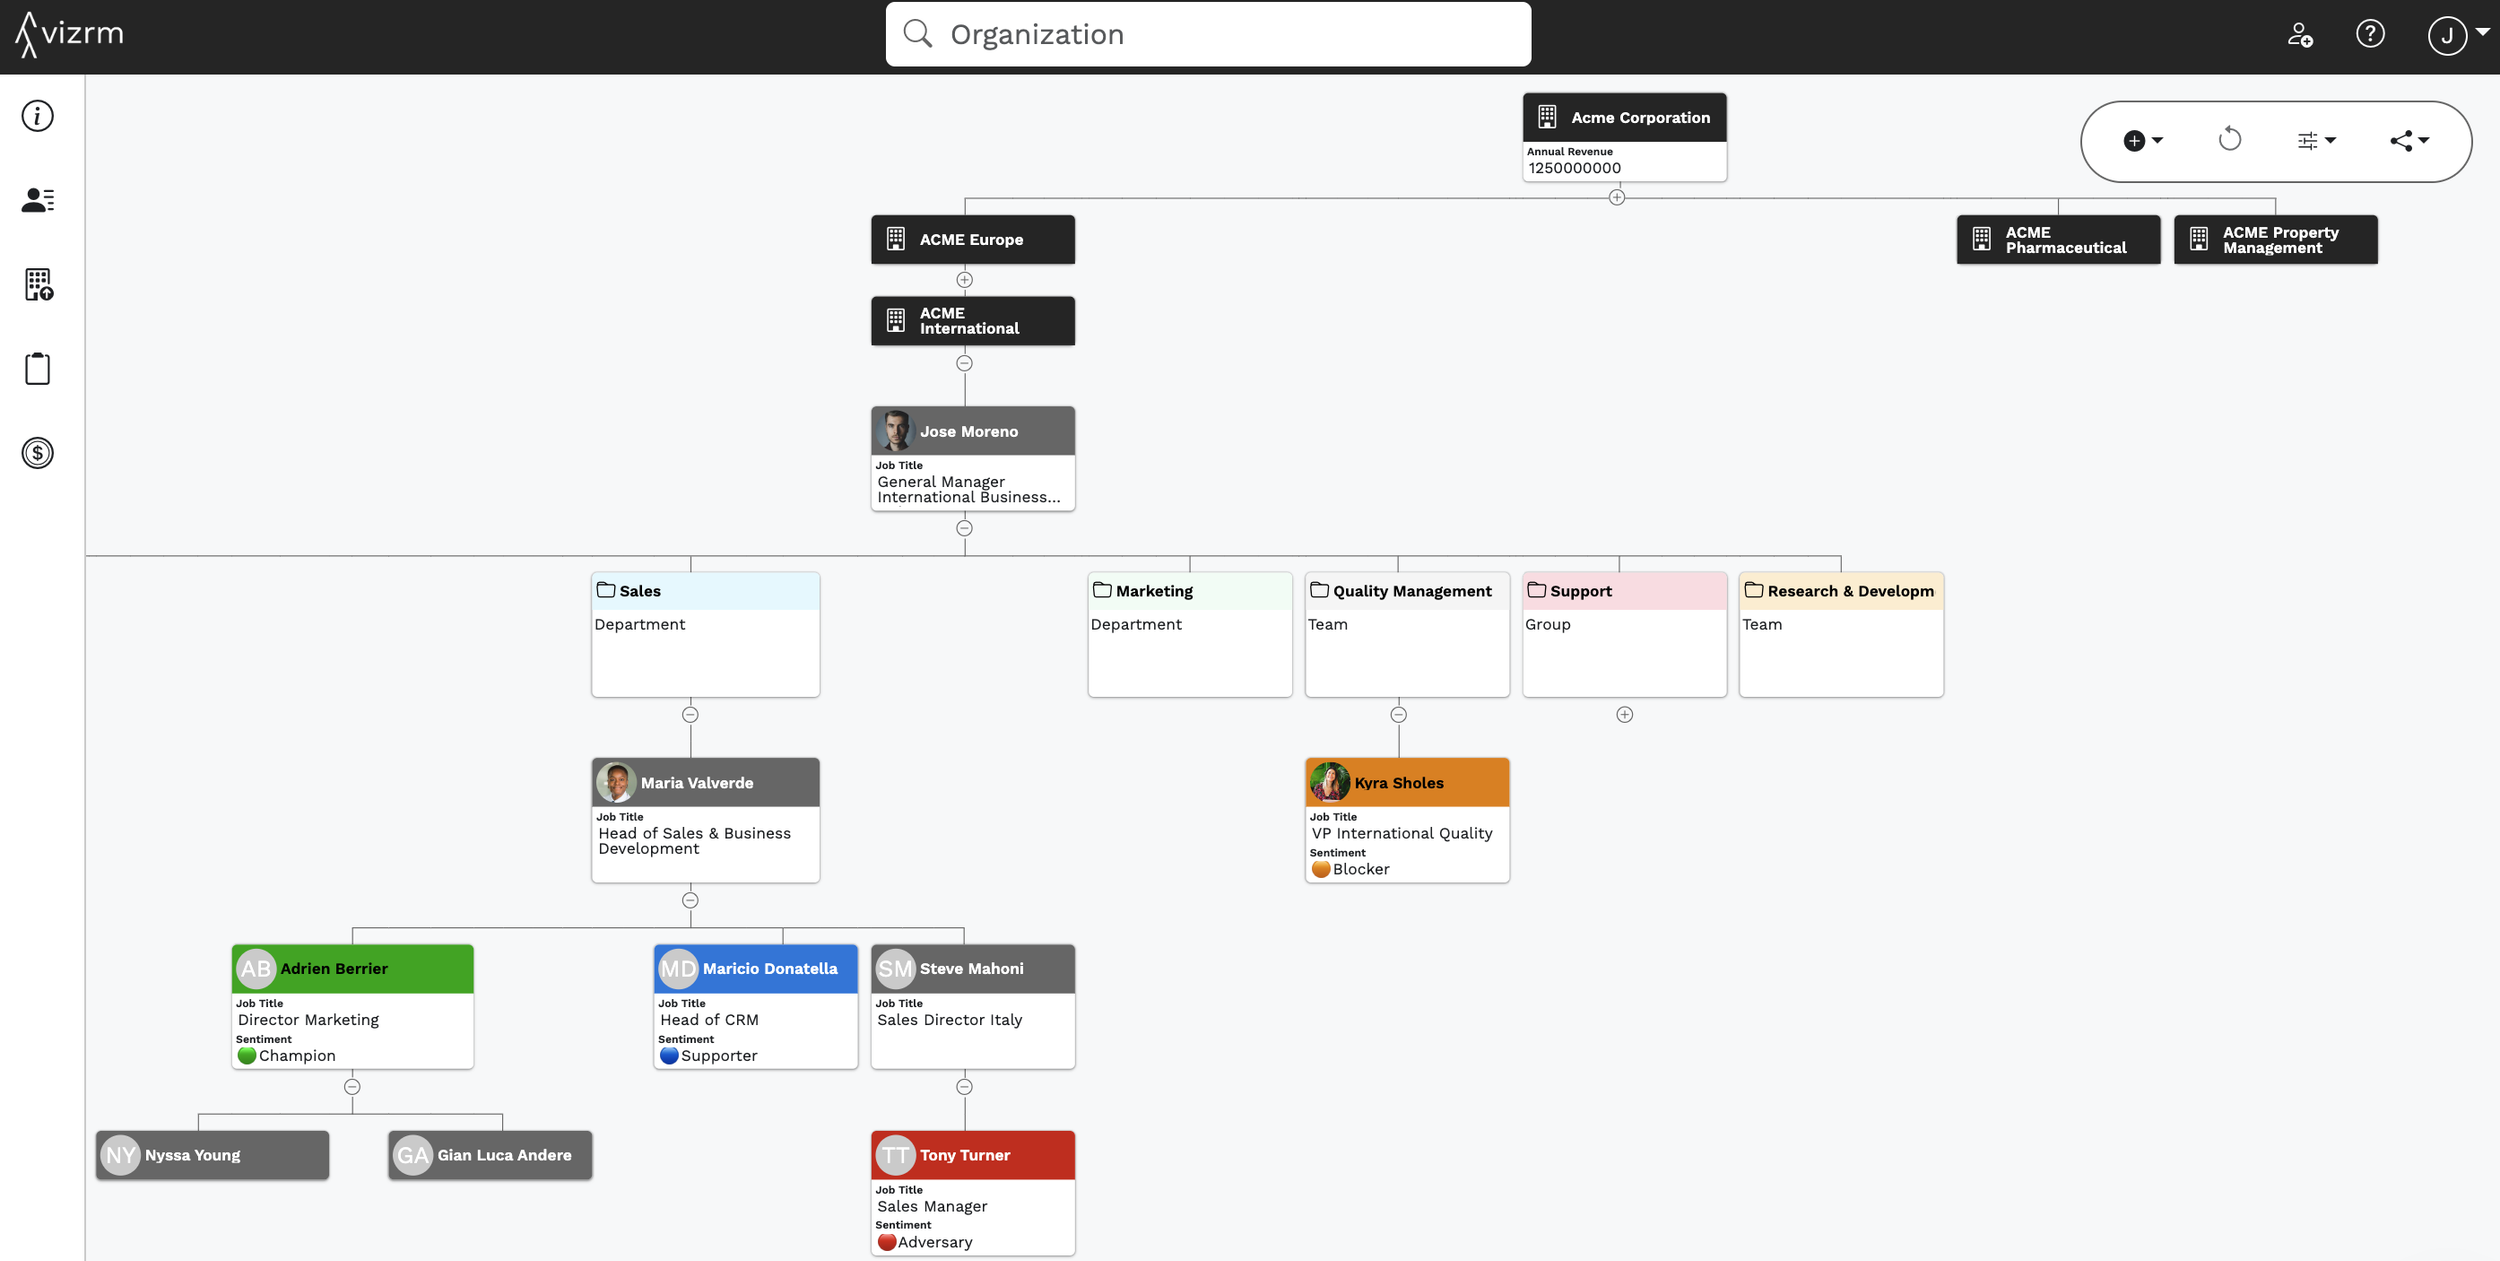
Org Chart in the context of a multi-national corporate structure

About the expert: Olivier Tyrbas is a Senior Strategic Account Executive, specializing in complex industrial sales across aerospace, defense, and food and beverage. A long-time vizrm customer, he has spent years refining signal-driven, relationship-first prospecting methods for enterprise accounts.